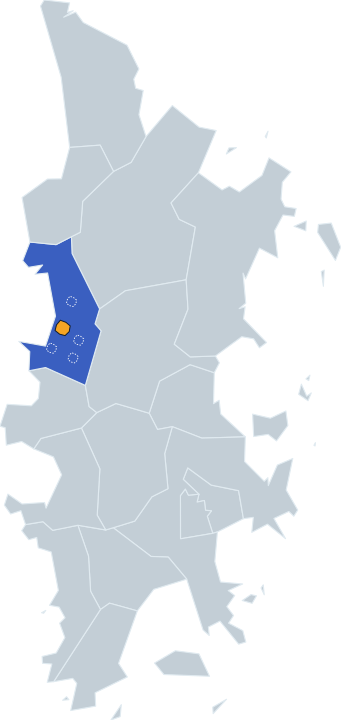
Unique data no one else has. We don’t estimate occupancy — we measure it. Start with the island, open an area, then open a complex.
Open layer. Level shown without percentages.
Laguna Parkside is open. Subscribe to see the occupancy level of every other complex in the area.
Start with the free map. Take the subscription to see the whole market, or a report when a single property decides a deal.
A licence to use the data with your clients, access for your whole team, volume pricing on reports, custom terms.
LocaIQ does not sell data. We grant a licence to use it for the duration of your subscription. A purchased report is yours to keep for your own use, with no resale or transfer to third parties. Verified occupancy data is currently in pilot.
Laguna Parkside is the first complex we measured. The ranking grows as more complexes are added.
Based on measured occupancy data, April–September 2026.
From a unit address to a decision-ready report in two to three business days.
Tell us the address or choose it on the map.
Independent data on how the property is actually used becomes an occupancy history, month by month, with a stated margin of error.
Occupancy history, comparison with similar units, supply in the complex, market context and an ROI estimate — as a PDF.
Occupancy of every house in the complex, April–September 2026, built from measured data. Open the sample to see what is free and what is in the paid report.
Show buyers measured occupancy instead of promises, earn a verification badge, and compare units across your projects. The Agency licence lets you use the data in client-facing materials.
Talk to usCompare your own units with the rest of the complex and price them on facts, not on guesswork. Pilot participants get access on special terms.
Join the pilotListings show what’s on offer. We show where people actually live.
Occupancy comes from independent data on how properties are actually used, not from listings or owner claims.
We operate under Thailand’s Personal Data Protection Act. We never publish personal data of residents or owners.
Our verified data layer is in pilot and building its history. Accuracy and depth grow with every season.
Where the data comes from, how a unit is classified as occupied or vacant, and how often everything is refreshed.
We work with independent data on how each property is actually used, with the consent of owners and management companies. An algorithm turns that into an occupancy history for every unit, and tells long-term rentals apart from short-term ones. The full method is on the How it works page.
The free map shows five levels only. Exact percentages, months and unit-by-unit figures are part of the subscription and the paid report.
Occupancy by complex with trends and seasonality, how many units are listed for sale and for rent, arrivals and transaction statistics, AI analytics, alerts for 5 favourite complexes and a monthly market report. Data is refreshed every two weeks.
A report costs roughly 0.1–0.2% of the deal. The work behind a ฿50M villa is deeper than behind a ฿8M studio, so the price follows three bands: ฿19,900, ฿29,900 and ฿49,900.
A subscription is a licence to use the data while it is active. A purchased report is yours to keep for your own use, with no resale or transfer to third parties. Using the data with your own clients is part of the Agency plan.
Today the open layer is Choeng Thale, with Laguna Parkside as the first measured complex. More complexes and areas are added step by step.
A property report is delivered within two to three business days.
No. Levels are estimates with a typical margin of ±5 percentage points. They are not an appraisal and not investment advice.
We reply within one business day with scope, price and timing.